Difference between revisions of "Enrichment analysis"
(Automatic synchronization with BioUML) |
(Mistaken file names update reverted) |
||
| Line 1: | Line 1: | ||
;Analysis title | ;Analysis title | ||
| − | :[[File:Enrichment-analysis-icon.png]] Enrichment analysis | + | :[[File:Data-Enrichment-analysis-icon.png]] Enrichment analysis |
;Provider | ;Provider | ||
:[[Institute of Systems Biology]] | :[[Institute of Systems Biology]] | ||
Revision as of 12:40, 16 May 2013
- Analysis title
 Enrichment analysis
- Provider
- Institute of Systems Biology
- Plugin
- biouml.plugins.enrichment (Enrichment analysis plugin)
Contents |
Enrichment analysis (GSEA)
Gene set enrichment analysis (GSEA) is an advanced categories classification technique which works with ranked set of genes. A group from classification is considered over-represented if most of input set genes belonging to the group are top-ranked genes. Ranking is specified by user via numerical column (Fold-change values, for example).
For this analysis you have to prepare input table having Ensembl genes as rows. If your data have different row identifiers, consider using "Convert table" analysis first.
Parameters:
- Source data set – Input table having Ensembl genes as rows.
- Species – Species corresponding to the input table.
- Weight column – Column to rank genes by. Gene is considered top-ranked if value in this column is the highest.
- Classification – Classification you want to use. List of classifications may differ depending on software version and your subscription. Use 'Repository folder' for custom classification.
- Path to classification root – Specify path to the folder containing classification tables, when 'Repository folder' is selected as classification. Only tables with 'Ensembl gene' type are used for the classification.
- Reference collection – If specified, this collection will be used as list of all Ensembl genes for custom classification. If not specified, list of all Ensembl genes will be created by combining all categories.
- Minimal hits to group – Groups with lower number of hits will be filtered out (nmin)
- Only over-represented (expert) – If checked, under-represented groups will be excluded from the result
- Number of permutations (expert) – Number of random permutations used for p-value calculation (10-10000). Bigger values increase p-value precision, but make the analysis slower.
- P-value threshold – P-value threshold (Pmax)
- Result name – Name and path for the resulting table
Result
As the result of this analysis you will see the table where each row corresponds to the single group. The following columns are always present in the result:
- ID: Accession number representing given group.
- Nominal p-value: (P): P-value, calculated for the group using random permutations of the ranks: fraction of random permutations which showed better ES. Only groups for which P ≤ Pmax are included into result.
- ES: Enrichment score (or the most extreme Kolmogorov-Smirnov score).
- NES: Normalized enrichment score. It's ES divided by average ES for all random sets which have the same sign.
- Number of hits (n): Number of genes from the input set matched to the group. Only groups for which n ≥ nmin are included into result.
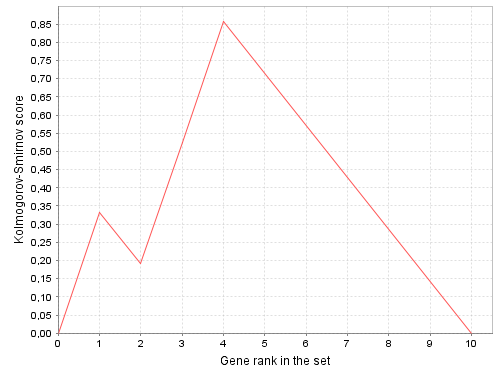
- Plot: Click to see the plot. The plot shows how Kolmogorov-Smirnov score (KS) depends on gene rank (r). Axis X shows gene ranks, axis Y shows KS value. KS can be defined recurrently as follows:
- Hits: List of Ensembl IDs from the input set matched to the group (number of IDs is always n).
More columns may present for specific classifications (e.g. group description). Column 'Level' if present means minimal number of steps necessary to achieve the root of classification hierarchy (thus higher values mean more specific and smaller groups).
Plot example
In this example plot is displayed for the set of 10 genes (N = 10) and 3 hits in the group (n = 3), which have ranks 1, 3 and 4. The most extreme KS value (which is enrichment score or ES) equals to KS(4), which can be calculated as follows:

