Difference between revisions of "Compute differentially expressed genes using Limma (workflow)"
m (Protected "Compute differentially expressed genes using Limma (workflow)": Autogenerated page ([edit=sysop] (indefinite))) |
(Automatic synchronization with BioUML) |
||
| (One intermediate revision by one user not shown) | |||
| Line 5: | Line 5: | ||
== Workflow overview == | == Workflow overview == | ||
[[File:Compute-differentially-expressed-genes-using-Limma-workflow-overview.png|400px]] | [[File:Compute-differentially-expressed-genes-using-Limma-workflow-overview.png|400px]] | ||
| + | == Description == | ||
| + | This workflow is designed to identify differentially expressed genes from several experimental conditions applying Limma statistics. Normalized data can be generated from Affymetrix ([http://test.genexplain.com/bioumlweb/#de=analyses/Methods/Data normalization/Affymetrix normalization Affymetrix normalization]), Agilent ([http://test.genexplain.com/bioumlweb/#de=analyses/Methods/Data normalization/Agilent normalization Agilent normalization]) or Illumina ([http://test.genexplain.com/bioumlweb/#de=analyses/Methods/Data normalization/Illumina normalization Illumina normalization]) raw data and submitted as input. Also un-normalized count data derived from RNA-seq experiment can be used as input for this workflow. Please note that the ''Limma'' method requires two or more replicates for each condition. It is necessary to provide a unique name for each condition. | ||
| + | |||
| + | The workflow compares up to five conditions / groups in one run. All possible comparisons between the input conditions are calculated in one workflow run. The first step of the workflow is a quality control of the input data and gives out a density boxplot and a density plot. The primary result of the Limma method is filtered by several conditions in parallel, applying the ''Filter table'' method to identify up- and down-regulated probeset IDs for each comparision. | ||
| + | |||
| + | Filteration criterion used is as follows: | ||
| + | |||
| + | '''Upregulated: logFC>0.5 && adj_P_Val <0.05''' | ||
| + | |||
| + | '''Down regulated: logFC<-0.5 && adj_P_Val<0.05''' | ||
| + | |||
| + | '''Non-changed genes logFC<0.002 && logFC>-0.002''' | ||
| + | |||
| + | The output folder contains gene tables as well as the images of the density boxplots and density plots. | ||
| + | |||
| + | Reference: Smyth, G. K. (2005). Limma: linear models for microarray data. In: Bioinformatics and 68 RNA-seq Computational Biology Solutions using R and Bioconductor. R. Gentleman, V. Carey, S. Dudoit, R. Irizarry, W. Huber (eds), Springer, New York, 2005. | ||
| + | |||
== Parameters == | == Parameters == | ||
;Input table | ;Input table | ||
| − | :Input table with all normalized | + | :Input table with all normalized files |
;Probe type | ;Probe type | ||
;Species | ;Species | ||
| − | ; | + | ;Condition_1 |
| − | ; | + | :Please enter condition or group name 1 |
| − | ; | + | ;1_Columns |
| − | ; | + | :Select columns for condition 1 |
| − | ; | + | ;Condition_2 |
| + | :Please enter condition or group name 2 | ||
| + | ;2_Columns | ||
| + | :Select columns for condition 2 | ||
| + | ;Condition_3 | ||
| + | :Please enter condition or group name 3 | ||
| + | ;3_Columns | ||
| + | ;Condition_4 | ||
| + | :Please enter condition or group name 4 | ||
| + | ;4_Columns | ||
| + | ;Condition_5 | ||
| + | :Please enter condition or group name 5 | ||
| + | ;5_Columns | ||
;Results folder | ;Results folder | ||
Latest revision as of 16:34, 12 March 2019
- Workflow title
- Compute differentially expressed genes using Limma
- Provider
- geneXplain GmbH
[edit] Workflow overview
[edit] Description
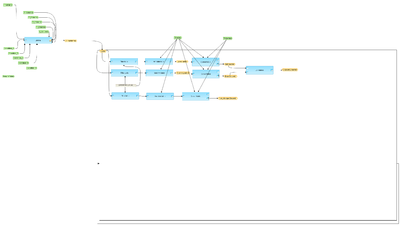
This workflow is designed to identify differentially expressed genes from several experimental conditions applying Limma statistics. Normalized data can be generated from Affymetrix (normalization/Affymetrix normalization Affymetrix normalization), Agilent (normalization/Agilent normalization Agilent normalization) or Illumina (normalization/Illumina normalization Illumina normalization) raw data and submitted as input. Also un-normalized count data derived from RNA-seq experiment can be used as input for this workflow. Please note that the Limma method requires two or more replicates for each condition. It is necessary to provide a unique name for each condition.
The workflow compares up to five conditions / groups in one run. All possible comparisons between the input conditions are calculated in one workflow run. The first step of the workflow is a quality control of the input data and gives out a density boxplot and a density plot. The primary result of the Limma method is filtered by several conditions in parallel, applying the Filter table method to identify up- and down-regulated probeset IDs for each comparision.
Filteration criterion used is as follows:
Upregulated: logFC>0.5 && adj_P_Val <0.05
Down regulated: logFC<-0.5 && adj_P_Val<0.05
Non-changed genes logFC<0.002 && logFC>-0.002
The output folder contains gene tables as well as the images of the density boxplots and density plots.
Reference: Smyth, G. K. (2005). Limma: linear models for microarray data. In: Bioinformatics and 68 RNA-seq Computational Biology Solutions using R and Bioconductor. R. Gentleman, V. Carey, S. Dudoit, R. Irizarry, W. Huber (eds), Springer, New York, 2005.
[edit] Parameters
- Input table
- Input table with all normalized files
- Probe type
- Species
- Condition_1
- Please enter condition or group name 1
- 1_Columns
- Select columns for condition 1
- Condition_2
- Please enter condition or group name 2
- 2_Columns
- Select columns for condition 2
- Condition_3
- Please enter condition or group name 3
- 3_Columns
- Condition_4
- Please enter condition or group name 4
- 4_Columns
- Condition_5
- Please enter condition or group name 5
- 5_Columns
- Results folder
