Quasi-steady-state analysis example
Description of the quasy-steady-state approximation method is done in the section "Quasi-Steady-State Analysis". Below we use the notation given there.
Reproducing a test case in BioUML
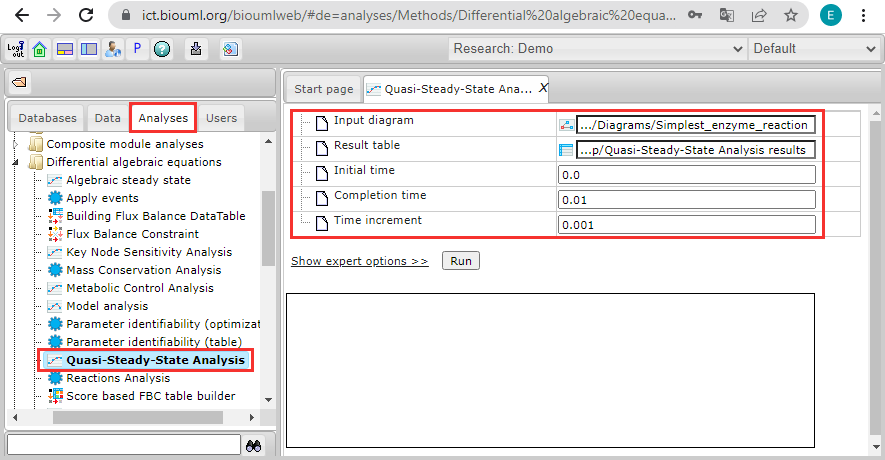
To reproduce a test case below in the BioUML workbench, go to the Analysis tab in the navigation pane and follow to analyses > Methods > Differential algebraic equations.
After double click on Quasi-Steady-State Analysis, a new tab with analysis opens.
Set the following analysis settings:
- Input diagram = data/Examples/DAE models/Data/Diagrams/Simplest_enzyme_reaction
- Result table = data/Collaboration/Demo/Data/Temp/Quasi-Steady-State Analysis results
- Initial time = 0.0
- Completion time = 0.01
- Time increment = 0.001
After you click the Run button and the calculations are finished, you can see the result table, including ranges of fast dynamics of diagram entities.
Ready analysis results can be found in the table:
data/Examples/DAE models/Data/Quasi-Steady-State Analysis results
Description of the test case
As an example we consider the simplest enzyme reaction
which involves an enzyme E binding to a substrate S to form a complex ES and its dissociation into a product P and the enzyme E.
Let us find the conditions under which the concentration of the complex ES is quasi-stationary in time t = 0. To do this, we consider the expressions
which result in the following derivatives
Next, we find the formulas for δtES and rES:
Thus, the complex ES is in quasi-steady state at t = 0 only when δtES << 1, i.e.
